


The PTE Speaking exam is the first of four main parts of the PTE exam. The PTE speaking exam format requires 75-90 minutes to complete six tasks. When taking the PTE speaking section, candidates must pay close attention to their reading, recalling, and learning skills. Test-takers will encounter similar question types throughout the PTE speaking lessons. The six different types of assigned tasks are:
#1. Personal Introduction
#2. Read Aloud
#3. Repeat Sentence
#4. Describe Image
#5. Retell Lecture
#6. Answer Short Questions
Bar Graph for PTE: Describe Image for the Speaking Module
One of the most challenging tasks on the PTE Academic Exam and the Speaking module is Describe Image. A test taker has around 25 seconds to examine and prepare their response to a particular image or graph. After the timer has expired, the test taker has 40 seconds to record their audio response through the microphone; be sure to cover all the relevant details. The test-taker will hear a tone once the microphone is turned on. The test-taker should begin speaking after hearing the tone. The progress bar tracks the progress as the recording begins; the status changes from “recording” to “recording completed” as the recording is finished.
The work begins and ends before you realise it. It might be challenging to extract useful data in such a short time. It is pretty challenging to perform well in the Describe Image task unless you have a solid strategy.
Also Read: PTE Score for Study in Australia: Minimum PTE Score Required for PR in Australia
How to Analyse/ Understand the Bar Graph for PTE?

The bar chart is the best template for practising your Describe Image task because it lays out all of the elements in a rational, straightforward way. The theme, figures, contrasts or similarities are examples of these variables.
Here is a template you may use. However, you are free to design your own if it is more convenient for you.
#1. The information regarding (TOPIC/ TITLE) and the categories are represented in the bar chart.
#2. The chart shows that (FIGURE), which is (NAME OF CATEGORY), is the highest figure, followed by (NAME OF CATEGORY).
#3. The lowest figure, on the other hand, is (FIGURE), which is (NAME OF CATEGORY).
Finally, it is clear that (TREND/HIGHEST/LOWEST/SIMILARITY/DIFFERENCE).
Format to Describe PTE Image Bar Graph
#. First and foremost is the introduction. Start by speaking, “The provided (chart type) demonstrates/compares/describes…”
#. Next comes the main body. You can frame this by starting with: “A study of the (chart type) reveals that…”
After this, you must describe the story represented by the given image type. This is an essential element of the test, and a lot depends on how much information you can get from the graph by analysing it.
#. Finally, you can conclude by saying: “In conclusion/Concluding, we can say…” and then briefly summarise whatever you spoke.
#. It is important to describe all of the image’s parts, their correlations, and any prospective progression or consequences throughout the introduction, body and conclusion.
Also Read: PTE Band Score Chart 2021: Everything about Ideal PTE Band Scores and Validity
Tips on How to Clearly Describe the Image Bar Graph for PTE

This task might seem difficult without proper preparation because it judges you based on the content, pronunciation and fluency. To be well-prepared, one should have a set of predefined phrase structures or templates on hand, flexible enough to be utilised in various situations.
Consider the following tips if you want to complete the Describe Image task properly.
#1. Start with a general statement like “The graph in front of me provides information about…”
#2. Take a look at the title and the legend/note.
#3. Formulate a roadmap for yourself – from top to bottom/from left to right
#4. Use those words only which you are confident about pronouncing correctly.
#5. You must be logical in your explanation.
#6. It makes no difference if you don’t have a natural English accent. What is more important is that you pronounce the words clearly.
#7. Don’t be in a rush. Maintain a consistent tempo through vocal modulations, such as emphasising key phrases and taking suitable pauses. Avoid using a flat tone.
#8. For a more detailed image, identify the pattern or significant aspects immediately and just explain them.
#9. You may include a data comparison between multiple picture components. When you provide or explain comparable data, it shortens your execution time and aids in sentence construction.
Also Read: How to Book PTE Academic Test Online? Tips to Clear the Test and Steps to Apply
#10. It is crucial to keep track of the time allowed continuously. Always try to finish your answer within 40 seconds.
#11. Do not speak until you hear the buzzer.
#12. Avoid long pauses or using phrases like ‘uh’, ‘hh’,etc., because you are judged on your oral fluency.
PTE Practice – Bar Graph PTE Describe Image
Describe the bar graph provided below.
#1. Sample Answer

#. The bar chart depicts the percentage of students fluent in at least one foreign language in six countries: China, Romania, Thailand, India, Russia, and Vietnam.
#. Among these countries, India has the largest percentage of pupils who can speak in a language other than their native tongue, followed by Romania, Vietnam, Russia, Thailand, and China.
#. In most countries, the percentage of female students fluent in a foreign language outnumbers that of male students, albeit the difference is not statistically significant. The sole exception is Thailand, where males outnumber females in the ability to speak in a foreign language.
Also Read: How Long to Prepare for PTE Academic Test? Simple Tips to Stay Exam Ready
#2. Sample Answer
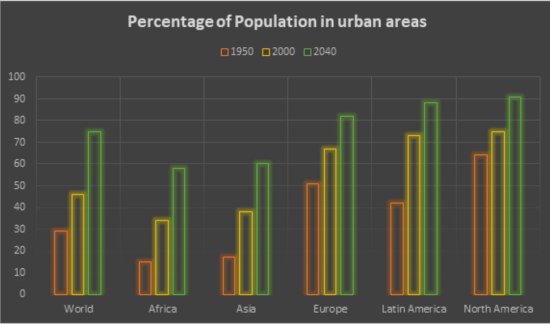
#. The bar chart compares the world’s urbanisation percentage in 1950 to the percentage in 2000 and the anticipated percentage for 2040.
#. Between 1950 and 2000, Africa and Asia saw the most urbanisation, with the rate of urbanisation more than doubling. The graph also shows that although being lower in 1950, Latin America’s urbanisation is expected to be higher than Europe’s by 2040.
#. To sum up, the share of the global population living in cities is anticipated to go four times by 2040.
#3. Sample Answer

#. The bar chart depicts statistics on people’s drinking habits in the United States by age group.
#. The age group 16 to 24 had the highest percentage of individuals who never drank. With age, the percentage tended to decline. Only 40% of those aged 65 to 74 had never drunk. On the other hand, the percentage of individuals who had stopped drinking increased with age.
# A unique trend emerged when it came to the percentage of heavy drinkers. People in their forties and fifties (45 to 54 years old) drank the most (about 13% of the total). A tiny number of individuals in the youngest age group, and an even smaller percentage of those in the oldest age group (about 3%), drink excessively.
Overall, age appears to play a key role in drinking behaviour patterns.
Also Read: How many PTE Score required for Australia PR? Tips on Increasing PR Points Through PTE
Conclusion
The bar graph PTE (describe image) task is sometimes considered to be one of the hardest tasks. This is only true when you are not properly aware of or prepared for the task. With proper practice and understanding, this becomes one of the easiest tasks. IELTS Ninja provides you with the best resource material such as practice tests, exercises and so on. These resources can make the PTE describe image bar graph task extremely easy for you and help you achieve a good score in this section, thus boosting your overall score.
<class=”s1″>


Thanks for showing me a quick way of solving graphs because I was taking a lot of time to solve them.