


The Pearson Test of English is one of the widely accepted language ability tests for a student visa or Permanent Residence. The PTE test is conducted online by Pearson Inc across countries. The results of the PTE academic test are processed in five business days from the exam date. The exam’s duration is three hours. The exam will be divided into three parts: Speaking & Writing, Listening and Reading.
Bar graph for PTE is part of the describe image questions in the Speaking module. Let’s find out how to ace these questions within the given time limit.
Also Read: Writing Task 1 Line Graph: Follow the Trends to Boost Your Vocabulary
Bar Graph for PTE Describe Image
All three modules of the test have different types of questions to be solved in the given time. It can be challenging, but no worries, because this exam is easy if you practice adequately. A total of 8 questions are asked in the PTE Speaking and Writing module:
#1. Personal Information
#2. Read Aloud
#3. Repeat Sentence
#4. Describe Image
#5. Re-tell Lecture
#6. Answer Short Question
#7. Summarize Written Text
#8. Essay
The bar graph for PTE comes under the describe image question.
Describe Image
Describe Image is one of the eight questions in the Speaking & Writing module of the PTE test. The task is simple where you will be shown an image, and you have to describe it. The image can be in the form of a pie chart, a graph or a bar chart. The recording status box will be displayed with a countdown until the microphone starts recording. Every candidate gets only 25 seconds to study the image and prepare their answer.
A short tone will be played, and the candidate has to start speaking their answer immediately. The candidate gets only 40 seconds to record their response. Remember, you have to start speaking immediately right when you hear the short tone, not before. You can record your answer only once.
Also Read: Writing Task 1 Line Graph Questions: Guide to Write Report of Line Graph
How to Describe Bar Graph in PTE?
The bar graph will display information about any topic. You have to understand it well and answer. So here we provide some examples which will clarify how to describe bar graphs in PTE.
#. Example Bar Graph 1
Number of Animals in Alaskan Habitats
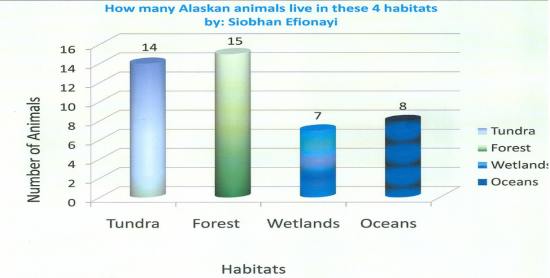
Photo: flickr.com/photos/dw2002/5451586006
(The graph is displayed only to teach how to read it)
Answer: The above bar graph for PTE displays the number of animals present in the four habitats of Alaska, which are: Tundra, Forest, Wetlands and Oceans. The first bar displays fourteen different species of animals living in the tundra habitat. The second bar displays that fifteen animal species live in the forest habitat. Seven different species of animals live in the wetlands habitat. And eight animal species live in the ocean habitat.
#. Example Bar Graph 2

Shuttle Missions Per Year
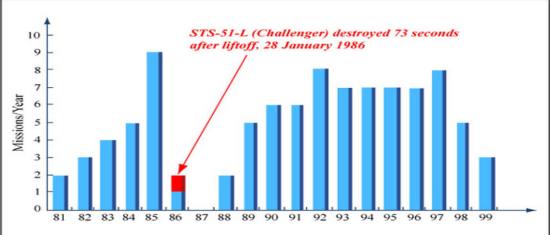
Photo: flickr.com/photos/mitopencourseware/4011085955
(The graph is displayed only to teach how to read it)
Answer: The above graph displays the number of shuttle missions conducted per year from 1981 to 1999.
#. Two Shuttle Missions in the year 1981
#. Three Shuttle Missions in the year 1982
#. Four Shuttle Missions in the year 1983
#. Five Shuttle Missions in the year 1984
#. Nine Shuttle Missions in the year 1985 (Most number of Shuttle Missions in a year)
#. One Shuttle Missions in the year 1986 (The STS Challenger on this mission was destroyed 73 seconds after the liftoff on 28 January 1986)
#. Zero Shuttle Missions in the year 1987
#. Two Shuttle Missions in the year 1988
#. Five Shuttle Missions in the year 1989
#. Six Shuttle Missions in the year 1990
#. Six Shuttle Missions in the year 1991
#. Eight Shuttle Missions in the year 1992
#. Seven Shuttle Missions in the year 1993
#. Seven Shuttle Missions in the year 1994
#. Seven Shuttle Missions in the year 1995
#. Seven Shuttle Missions in the year 1996
#. Eight Shuttle Missions in the year 1997
#. Five Shuttle Missions in the year 1998
#. Three Shuttle Missions in the year 1999
Also Read: How many PTE Scores are Required for Australia Student Visa? Minimum Scores
Maximum nine and minimum one Shuttle Missions were conducted per year between 1981 and 1999. And only 1987 was the year when no missions were conducted.
You can also describe bar graph number 2 in another way:
Maximum nine missions were conducted in the year 1985, eight missions in the year 1992 and 1997, seven missions from the year 1993 to 1996, six missions in the year 1990 and 1991, five missions in the year 1984 and 1998, 4 missions in the year 1983, 3 missions in the year 1982 and 1999, two missions in the year 1981 and 1988, one mission in the year 1985 where the SLS challenger destroyed 73 seconds after the liftoff. No missions in the year 1987.
You have only 25 seconds to skim through and understand the whole bar graph in PTE describe image test. So what you can do is, focus on the major and important information in the bar graph PTE image. Understand the idea behind the representation of the information in the graph. When you understand the bar graph, ensure you organise your answers. Organising the answers will make you reproduce the information in order. It will help you to pick the major information first, and you will be left with time to draw a conclusion.
Speak out all the contents and elements of the image at a natural pace; don’t hurry or stop in-between. Ensure you are pronouncing every word correctly, as all these factors are considered for evaluation of the bar graph PTE test.
Conclusion
The bar graph PTE describe image task is not that hard if you practice enough. The only challenge you would face is the time limit. Practising the bar graph PTE test will help you in time management to answer in the given duration. You can join the extensive PTE program offered by the IELTS Ninja for preparation. PTE program of IELTS Ninja provides you with a personal trainer and nine mock tests to prepare you for scoring high in exams. Visit their website for more of such informative content.
Also Read: PTE Score for Study in Australia: Minimum PTE Score Required for PR in Australia
<class=”s1″>


Bar graphs look simple but it’s very hard to understand but this article showed the steps very nicely which made it easier for me to understand and help me with the preparation