

A line graph is another kind of question in IELTS academic writing task 1 and the strategy to write a report on such questions is very similar to the bar chart questions. In this type of question, you may find two types of a line graph: simple and complex.
In the simple single-line graph IELTS questions, you may find one line in the graph, on the other hand, in the complex graph, you may get two or more lines in the graph.
These lines can be of different colours or different types. For such complex line graphs, labels/ legend is given on one side of the graph for you to identify which line corresponds to what data.
Let’s now find in detail how to write a report on line graph IELTS task 1 type of questions in the academic IELTS writing task 1.
Step 1
Read Question Properly to Write The Introduction
The introduction is the first few lines you write in your report and the following sues can be used to write it:
Point 1
Reading the questions thoroughly. If you don’t do so, you would be missing out on something important. You can begin your introduction by paraphrasing the line graph question.
Point 2
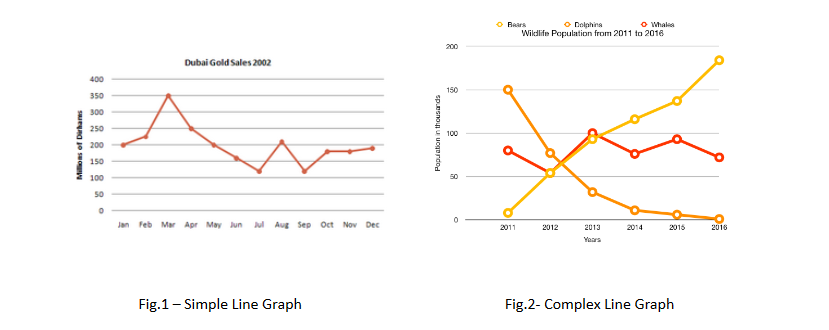
Next, have a look at the line graph carefully and check its heading since the heading may give you a better idea of what the line graph is about. For example, the simple line graph in Fig.1 is about Gold Sales in Dubai in 2002.
Point 3
Lastly, look at the labels on its x-axis and y-axis to find out the units. We will need to include the units in the introduction, for example, “in the period of 5 years from 2017-2022” or “from Jan to Dec 2002” etc.
The three points above will help you write an appropriate introduction to your report.
Step 2
Analyse The Line Graph IELTS Task 1 Question to Write The Body Paragraphs
You can write one body paragraph in detail if you have got a simple line graph, where you can mention the starting point of a line, the peak points and the trends such as gradually decreasing, constantly increasing, stable etc.
However, if you have been given two or more lines in the graph, you can prefer writing two body paragraphs so that you are able to mention enough details about them.
You can first write about the individual lines in the first body paragraph similar to the simple line graph description. In the second body paragraph, you can compare and contrast the multiple lines together.
Also Read : Most Common Spelling Mistakes in IELTS and How to Avoid Those?
IELTS Writing Task 1 Line Graph Vocabulary
Use some of the following essential words for line graph description IELTS:
| S.NO | Line Graph Tend | Words Used To Explain Line Graph Trend |
| 1 | Upward Trend | Rise, Rose, Increase, Peak, Grow, Go Up, etc |
| 2 | Downward Trend | Fall, Decrease, Dip, Drop, Come down, etc |
| 3 | Constancy | Level out, Remain constant, No change |
| 4 | Adverbs | Steadily, Slowly, Slightly, Gradually, Steeply, etc |
Adverbs Used in IELTS Writing Task 1 Line Graph with Meanings
| S.NO | Adverb Used In Line Graph | Meaning |
| 1 | Slowly | Small increase |
| 2 | Steadily | Little or no variation |
| 3 | Slightly | Small increase but not considerable |
| 4 | Gently | Increasing at constant pace but not abruptly |
| 5 | Gradually | Small increase with variation |
| 6. | Steeply | A quick and sharp increase |
In the body, paragraphs make sure to use numbers/ data/ dates, etc to support your description of the graph.
Example
The below sentence can be taken as an example to explain the line graph with a clear explanation about rising and fall in the graph. It is important that you notice the rise, fall or other trends in the graph and then use respective words to represent the graph.
“The sale of gold in Dubai in 2002 rose sharply from 200 million dirhams in January to 350 million dirhams in March.”
Explanation:
Based on the above example we have taken, we have explained how the graph works and how we can make use of IELTS writing task 1 line graph vocabulary words listed in the table to use.
- In the above example, we see that “Sale of gold in Dubai” is what the graph is about while it is being represented by two-axis or lines X and Y which are year and sales in million.
- Now we see that the sale of gold has increased sharply from 200 million to 350 million that shows an upward trend in the graph.
- So, we can check the table for Upward trends and use alternate words or meanings to describe the line graph easily.
Step 3
Compare and Contrast to Find Important Highlights
In order to write about the highlights of a line graph, you should compare the data represented by the lines. For example:
“The sale of gold in Dubai in 2002, rose sharply from 200 million dirhams in January to 350 million dirhams in March. However, in the next four months, the sales dropped down constantly and by July reached almost half of the gold sales in Jan.”
In complex IELTS task 1 line graph questions with multiple lines, you may like to bring out the intersection points of the lines or if two lines are following the same trend or opposite trends over a period of time.
Also mention the peak points at the start and at the end along with the corresponding data and also write whether it was at maximum or at lowest. These important highlights are nothing but the key features that make your writing task very scoring.
Line Graph IELTS Task 1 Sample:
“While the population of bears increased tremendously from near zero to nearly 200,000, that of Dolphins witnessed the opposite trend with their numbers dropping from 150,000 in 2011 to being decimated by the year 2016.”
Step 4
Include A Main Summary of The Line Graph
A writing task response needs to have a paragraph with the main summary or overview of the line graph, without which one could lose bands. This can either follow the introduction paragraph or be the last paragraph in the report.
Example:
“Overall, the monthly sales of gold in Dubai in 2002 fluctuated throughout the year. Whereas the average monthly sale of gold remained between 150 and 200 million Dirhams, it showed an exceptional surge in March to 350 million dirhams and two dips to 100 million dirhams in July and September. It ended the year with the same amount of sales as it had begun with at 200 million dirhams.”
Guidelines For Writing A Report on IELTS Line Graph Questions
Thus, the guidelines for writing a report on a line graph question is as follows:
- Have a clear introduction based on the question.
- Describe the line/ s in the body paragraphs mentioning the trends, etc using appropriate vocabulary.
- Have a main summary or overview in one paragraph, which should have all the main trends of the graph.
Also Read : How to Do Short Answer Type of Questions in IELTS Reading?


This article was very helpful for the line graph topics and it provided a detailed information, can you also provide some tips to boost your vocabulary for other sections?