


In today’s blog, we will be discussing a recent IELTS Writing Task 1 question that had come. A pie chart on energy consumption came for this section of the IELTS Writing task where different forms of energy production in a span of 10 years have been recorded in a country.
We will be analyzing the question in the way in which it needs to be approached and then talking about the points that can be included in our answer. Finally, we will be attempting an ideal answer so that you can understand how to go about this topic. Scoring well in the IELTS writing task pulls up your overall marks in the main IELTS exam.

Analysis Of The Question
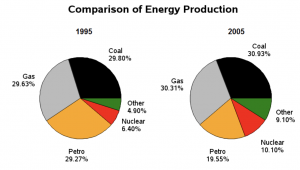
The pie charts compare the levels of energy production in a country during two separate years.
You should look at both the pie charts properly to understand how the different forms of energy such as petrol, gas, coal and nuclear energy are produced and note their percentages. You need to begin with an introduction where you will have to talk about what this pie chart depicts – energy production in a country within a span of 10 years. Do not compare the data but state only what is apparent here.
Next you will be required to write something about the main features of these pie charts. You could write about something interesting that you have noted such as the decrease in the production of petrol and the increase in the production of nuclear energy.
In the first body paragraph, write about the first interesting feature that you’ve made a note of- decrease in the production of petrol. Write about how its production has decreased significantly over a period of 10 years whereas the other forms of energy and their productions have remained constant.
In the second body paragraph, write about your second interesting feature- increase in the production of nuclear energy. Elucidate on how its production has gone up significantly. You can also mention that the production of other forms of energy have also increased in 10 years.
Brainstorming
Here, you can include pointers such as how the production of gas and coal have remained constant in ten years time but the production of petrol has reduced. This means that the country has been producing less petrol in comparison to the quantity that it had been churning out 10 years ago. On the other hand, nuclear energy production has gone up in this country and so, it is focussing more on nuclear energy. The country is also prioritizing other forms of energy production as the pie chart depicts that their levels have increased.
Ideal Answer
The pie chart above shows us the energy consumption in a particular nation within a span of ten years.
Overall, it can be observed that the production of coal and gas have marginally increased whereas the production of petrol has seen a downward trend in ten years. The production of nuclear energy has also increased along with other forms of energy.
In 1995, the production of coal, petrol and gas in this nation were more or less constant at 29%. The nation was not so focused on producing nuclear and other forms of energies as their percentages stood at 6.4% and 4.9% respectively.
However, we can see that in the year 2005, the production of coal and gas increased significantly in comparison to other forms of energies at 30%. Petrol was not being produced adequately as its percentage stood at 19.55% The production of nuclear and other forms of energies increased by 10% and 9% respectively.
Also Read: IELTS Writing Task 2 Essay Topic Internet Replace Books: Sample Answer of Essay Question