

If you wish to study abroad or get permanent residency, you need to clear an English proficiency test. PTE (Pearson Test of English) is one such English language test. Like any other English proficiency test, PTE also has set some scores cut off for the candidates. It is an entirely computer-based exam. There won’t be any moderator to ask you questions; everything will be automated through AI (Artificial Intelligence).
You will have three hours to complete the exam with three modules: Speaking & Writing, Listening and Reading. There’s a stipulated time for every question, which can make it difficult to answer some questions. The pie chart PTE questions are one such exercise. It requires special language skills to describe pie charts effectively, keeping the time limit in mind. Let us see how to explain the pie chart in the PTE exam in the given time with some tips.
यह भी पढ़ें: आईईएलटीएस लेखन कार्य 1 पाई चार्ट शब्दावली: आपके आईईएलटीएस लेखन कार्य 2 में सफल होने के लिए युक्तियाँ
Speaking & Writing Test Format
Speaking & Writing is the first test module in the exam. It is the most extended module of PTE that lasts for 77-93 minutes. The candidates are evaluated based on their writing and speaking skills. The English language required and asked in the module is the one that one would listen to in an academic environment. The Speaking & Writing module is consists of 8 questions in total:
#1. Personal Introduction
#2. Read Aloud
#3. Repeat Sentence
#4. Describe Image
#5. Re-tell Lecture
#6. Answer Short Question
#7. Summarise Written Text
#8. Essay
The first five questions are a speaking test, and the latter three questions are the ones you need to write.
Describe Image
Describe image is the question where an image appears on the screen, and you have to explain it in detail verbally. A countdown appears, showing the time until the microphone records. You will have only 25 seconds to understand the image and prepare your response. After 25 seconds, you will hear a short tone. You need to start speaking immediately after hearing the short tone and record your response.
You will have only 40 seconds to describe the pie chart in PTE.
A total of 5 different types of images are displayed in the PTE Academic Test:
#1. A Bar graph
#2. A Pie chart
#3. A Line chart
#4. A Table
#5. Or others like – Mixed charts, Flow charts, maps, pictures, etc.
Let us focus on how to describe the pie chart in PTE.
यह भी पढ़ें: आईईएलटीएस लेखन कार्य 1 पाई चार्ट: आईईएलटीएस में आगे बढ़ने के लिए लेखन युक्तियों के साथ एक संपूर्ण मार्गदर्शिका
How to Explain the Pie Chart in PTE?
Below some pie charts are displayed with answers to guide the candidates on picking out details from the pie chart. The percentage of a specific area will be displayed in the diagram with a name and colour; you just need to understand it.
#1. Pie Chart Example No. 1
Activities of people in 5th grade at Harpeth Hall
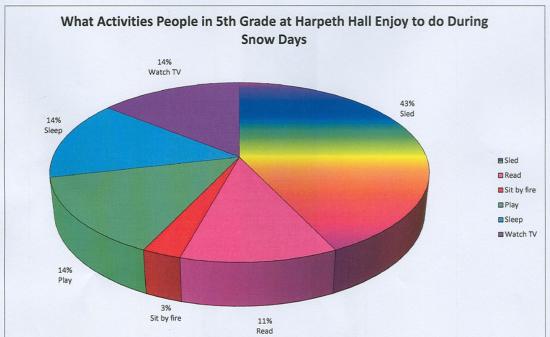
Photo: flickr.com/photos/dw2002/5451586804
(The Pie Chart is displayed for educational purposes only)
उत्तर: The pie chart segregates the activities in which the pupils of 5th grade at Harpeth Hall indulge in during the snow days. It is illustrated that 43% of the pupils indulge in riding on the sledge in the snow, 14% enjoy watching TV during the snow days, and 14% of the pupils like to play around. Another 14% of pupils like to sleep. 11% of them like to read books, and only 3% of them sit by the fire during the snow days.
यह भी पढ़ें: आईईएलटीएस राइटिंग टास्क 1 में पाई चार्ट का वर्णन कैसे करें? सबसे अच्छा तरीका जानें
These are the activities which the 5th-grade pupils enjoy doing during snow days at Harpeth Hall.
#. Pie Chart Example No. 2
Pets that 30 Students Liked
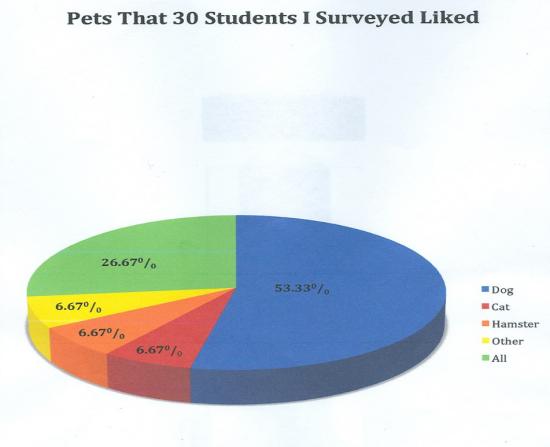
Photo: flickr.com/photos/dw2002/5451587222
(The Pie Chart is displayed for educational purposes only)
उत्तर: The pie chart here represents the survey conducted by a man upon 30 kids to know which pet they like the most. It illustrates that 53.33% of them like dogs, which is the maximum number. 6.67% of the students like cats as pets. 6.67% of the students like the pet Hamster. 6.67% of students said they like other pets apart from dogs, cats and hamsters, and 26.67% of students said they like all the pets.
You have to sum up your answer in 40 seconds. You can also add a conclusive line in the end if you have time, but no subjective opinion.

Tips to Describe Pie Chart in PTE
Focus on the Major Information
A pie chart image will display several details. You just need to focus on the major information in the pie chart. Focus on what is the major theme or main idea behind this pie chart. And the second thing which you need to focus on is the details that illustrate the information behind that main idea or theme.
You can write them down in your notepad.
यह भी पढ़ें: पीटीई अकादमिक टेस्ट ऑनलाइन कैसे बुक करें? टेस्ट पास करने के टिप्स और आवेदन करने के चरण
Organise the Description
If the information derived from the pie chart is organised in your thoughts and mind, you can frame a better response. When you have the information organised you know how you can decide the flow of information in your speech. It will enable you to keep it within the given time limit.
How to Score in Pie Chart PTE?
Let us focus on how you can score better in pie chart questions. Besides passing the exams, you also need decent scores to meet the required eligibility criteria for admission to a foreign university. Your description of the image is evaluated on the following three aspects:
#1. Content
Content signifies the information about the pie chart which you record in the response. You should describe all the relevant information in the image. Your description of the image should have logical and specific information, including possible developments, implications or conclusions. Mentioning only some of the information in an unorganised manner will result in negative marking.
#2. Oral Fluency
Your way of speaking has to be smooth, at a natural pace. You have to focus on answering with appropriate phrasing, smooth rhythm and enough stress. Speak at a constant and natural rate of speech. And do not hesitate, repeat or false start the statement, or else it will affect the score.
#3. Pronunciation
Speak in a way that your response should be understood by a regular speaker immediately. To give the best response, ensure you pronounce the vowels and consonants in a native-like way, stress on the words and phrase them correctly.
निष्कर्ष
These tips to describe the pie chart in PTE are easy to follow. But they don’t work like a miracle during the time of the test. You need to prepare yourself for it by practising regularly. Take mock tests, look over different pie charts on the internet and try to describe them. It will help you to master the techniques and produce better results. If you need assistance with your preparations, then आईईएलटीएस निंजा is the best place to go.
IELTS Ninja provides a three-week program for PTE preparations with face to face mentoring, nine mock tests and a lot more, so check out the course details now.
यह भी पढ़ें: पीटीई बैंड स्कोर चार्ट 2021: आदर्श पीटीई बैंड स्कोर और वैधता के बारे में सब कुछ
<class=”s1″>


जानकारी के लिए धन्यवाद, यह बहुत उपयोगी थी